"Addressing the Urban Heat Island Effect through an Equity Lens: A Community Science Project" is a campaign that focuses on the intersections of extreme heat, health, and social inequities.
The goal of this project is to make heat and its disproportionate impacts visible through mapping how impacts of extreme heat are compounded by various axes of inequities, including historic and ongoing systemic racism, poverty, health disparities, and more.
As anthropogenic climate change worsens, extreme heat is a recurring issue that is increasing in frequency and intensity. Extreme heat can negatively impact people's health, ranging from triggering temporary acute conditions to exacerbating existing illnesses and causing death. In the United States, more people each year from heat than from all other weather-related disasters combined, demonstrating the significant morbidity and mortality burden extreme heat carries.
The project was part of a multi-year nationwide campaign, part of the NIHHIS (National Integrated Heat Health Information System) jointly developed by NOAA (National Oceanic and Atmospheric Administration) and the CDC (Centers for Disease Control and Prevention), and partnered with CAPA Strategies. New York and New Jersey were part of the 2021 campaign, which included 12 cities across the US. The New York campaign partnered with South Bronx Unite, a local grassroots community organization working to improve and protect the social, environmental, and economic future of Mott Haven and Port Morris area of the Bronx.
What geographical area does this project cover?
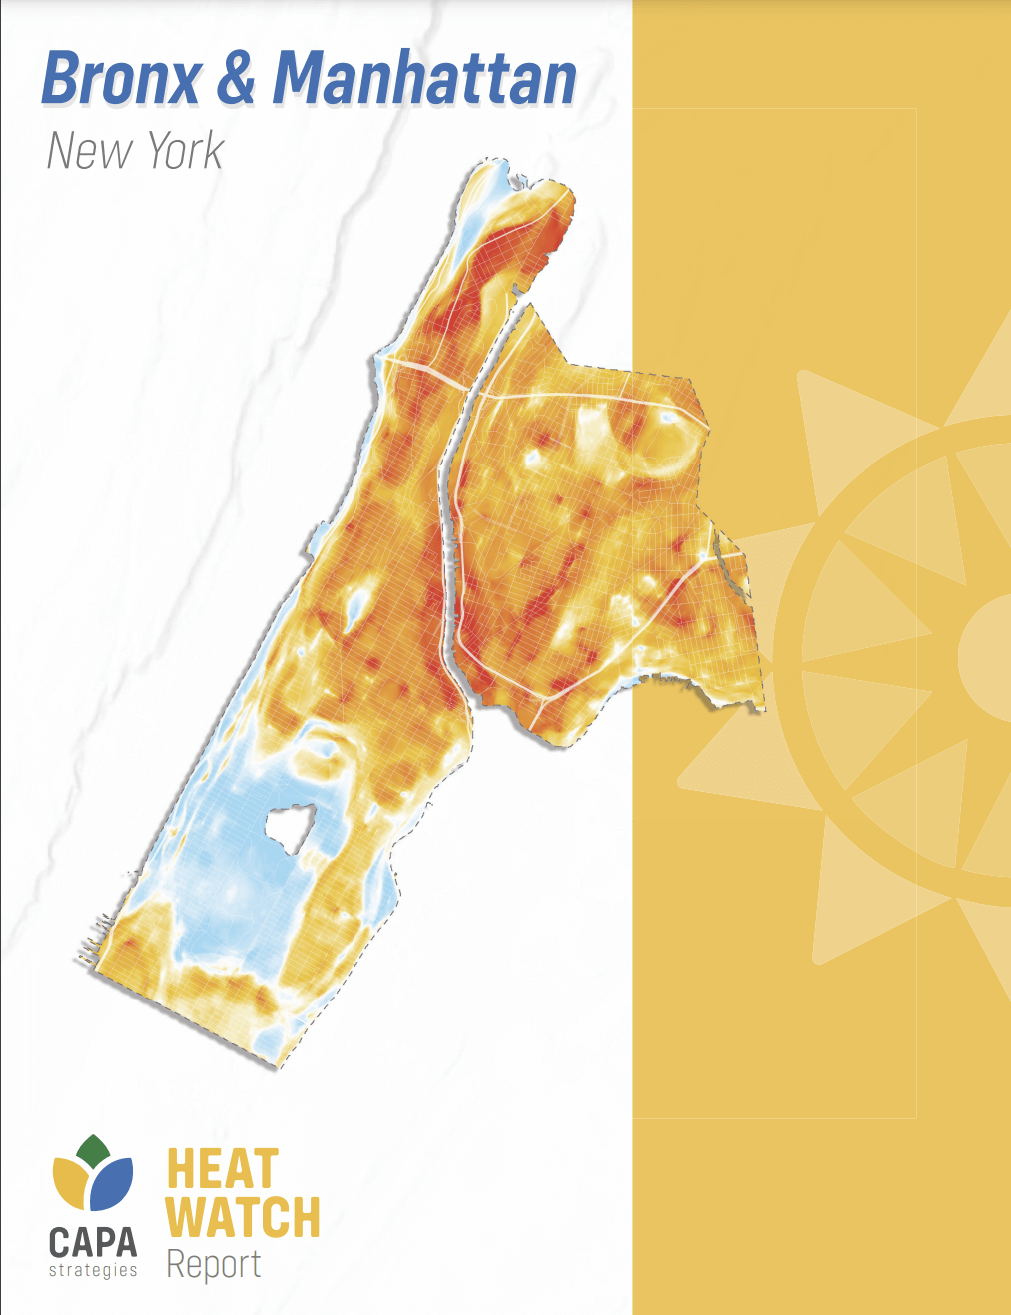
NYC: Northern Manhattan (Harlem, West Harlem, East Harlem, Washington Heights, Inwood) and the South Bronx (Mott Haven-Port Morris, Hunts Point, Longwood, High Bridge, Concourse, Claremont Village, Melrose).
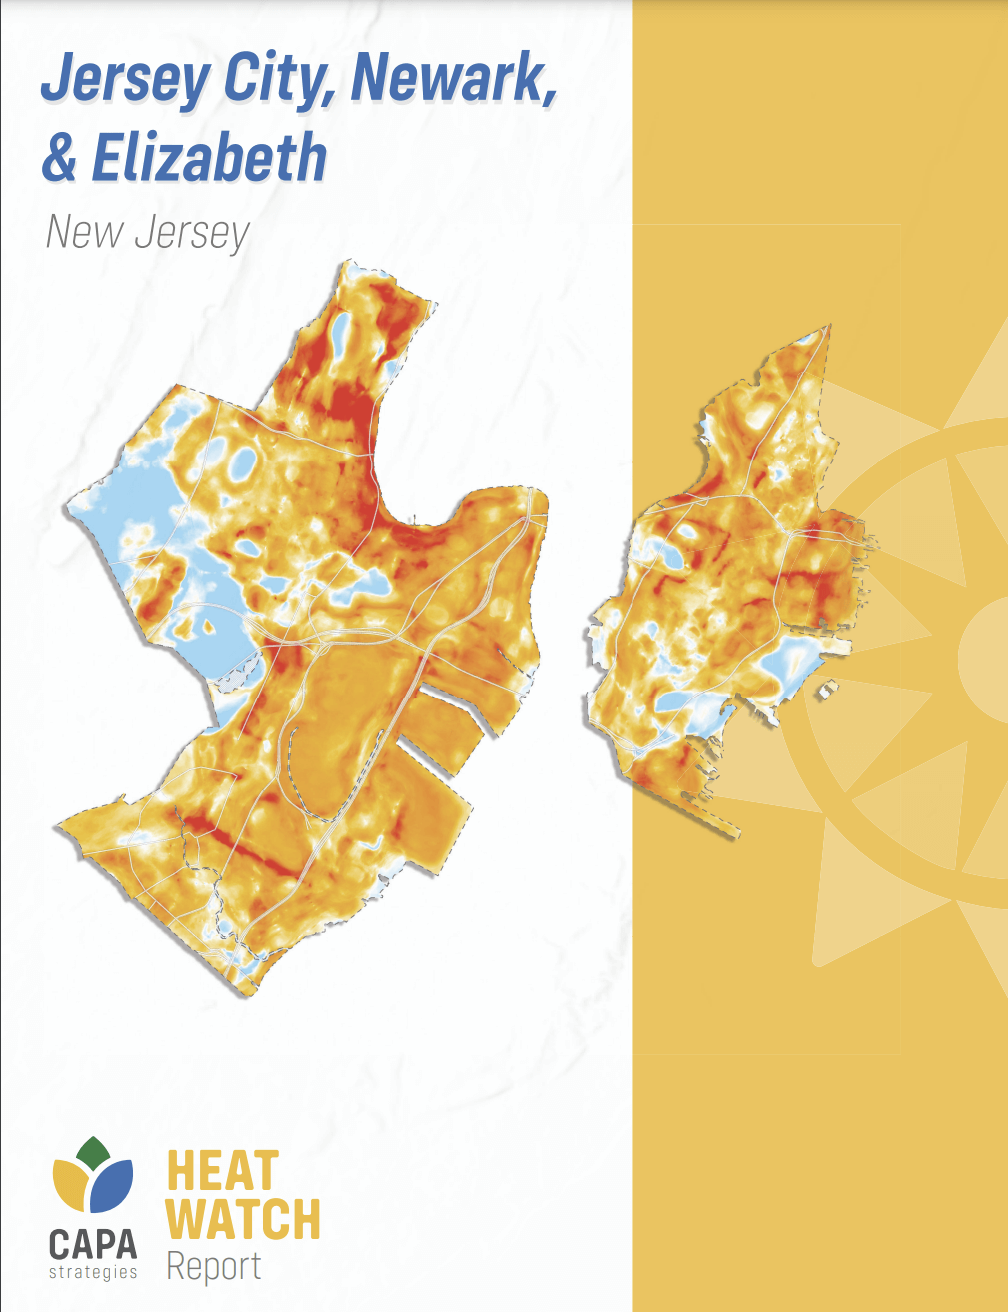
NJ: the cities of Jersey City, Newark, and Elizabeth.
CLICK ON THE IMAGE TO SEE CAPA'S RESULTS REPORTS FOR EACH AREA
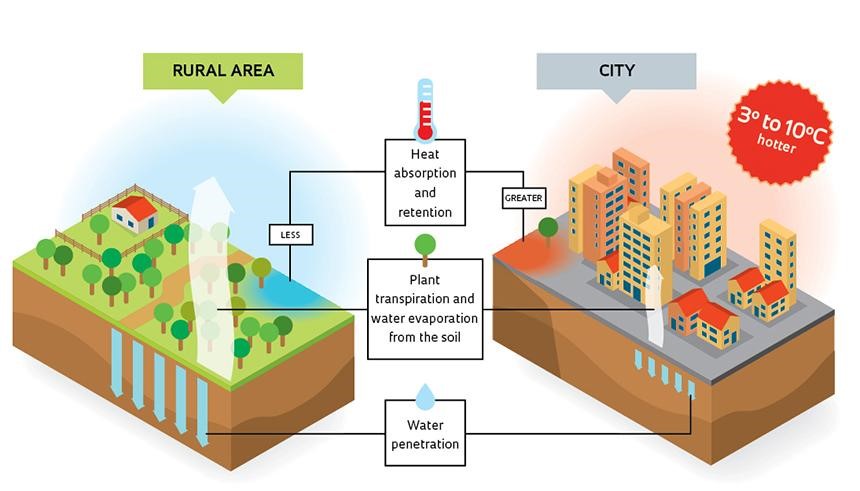
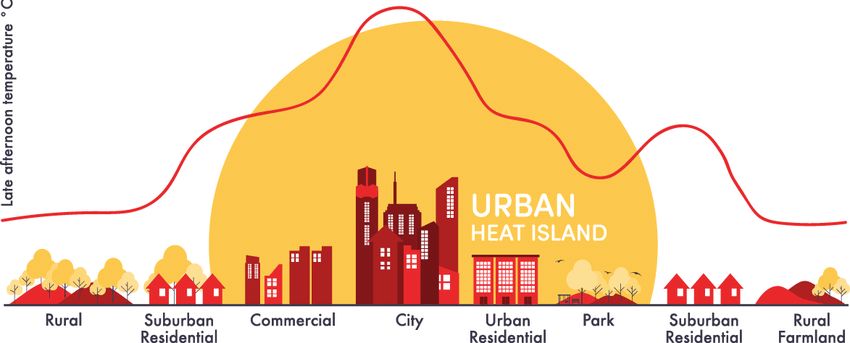
The urban heat island effect (UHIE) is a phenomenon in which cities maintain higher temperatures than their rural surroundings. These higher temperatures are due to reasons including:
- Higher absorption and trapping of heat by building materials like asphalt, concrete, brick, dark roofs, and pavement
- Tall buildings densely packed together
- High traffic
- Carbon-emitting infrastructure
- High total energy usage
This effect does not only occur in the day but also at night — when our bodies need to cool down to recuperate from a hot day, the difference can be even starker: with urban centers ranging as much as 22 degrees warmer than rural areas nearby.
Global temperatures and urban populations continue to rise, which makes this an ever-urgent problem. A study involving 13,000 urban areas found that city dwellers' exposure to life-threatening heat and humidity has increased threefold since the 1980s.
What is “community-science”? How was it key to this project?
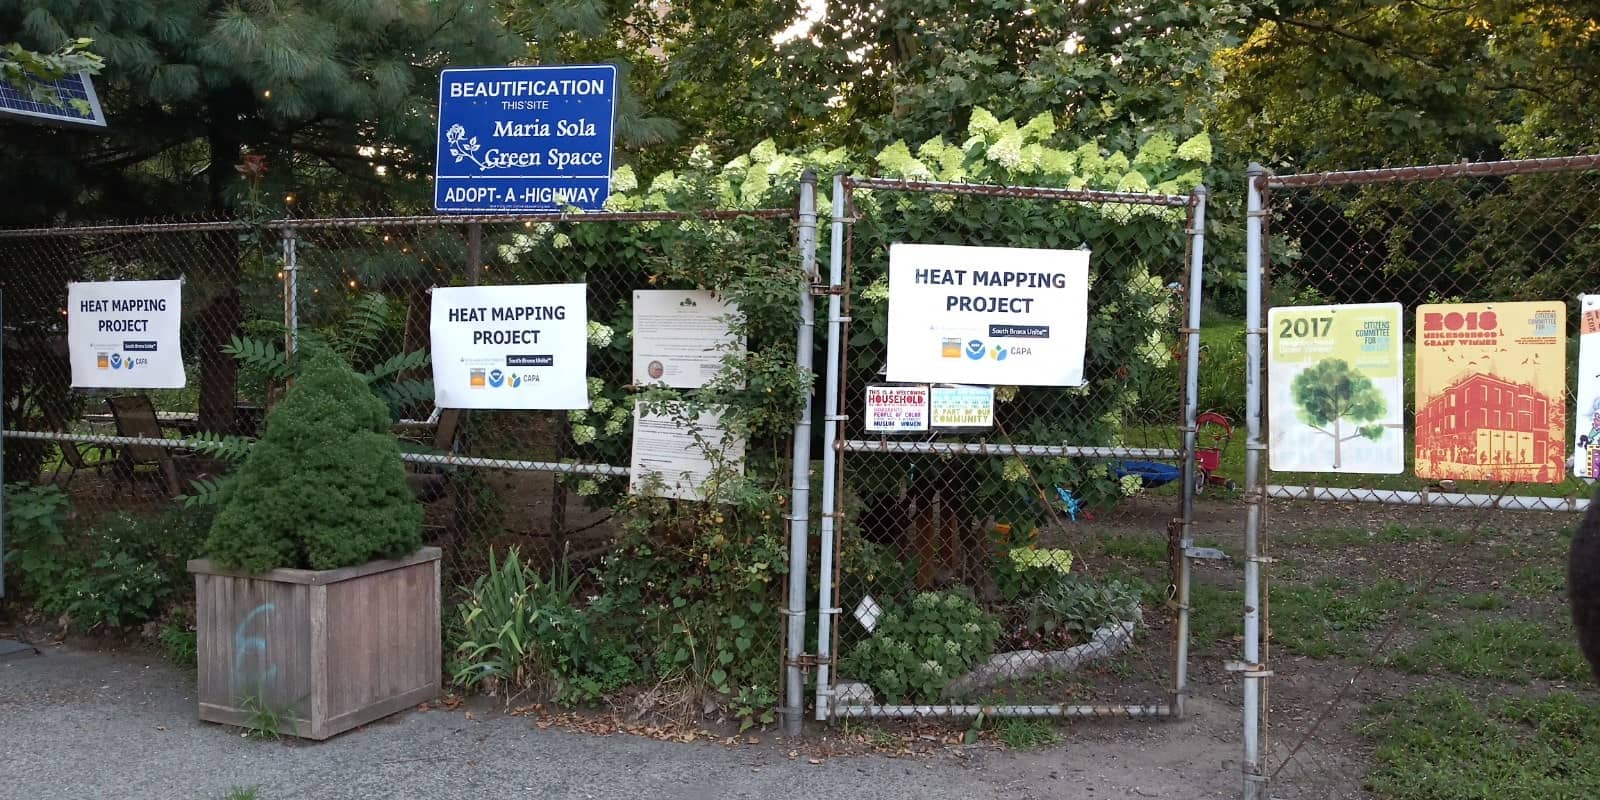
Because environmental justice was a core element to our project, the NYC campaign partnered with the community-based organization, South Bronx Unite, who already had ongoing advocacy efforts around extreme heat, air pollution, and greenspace (among others), making the collaboration a good fit for both parties.
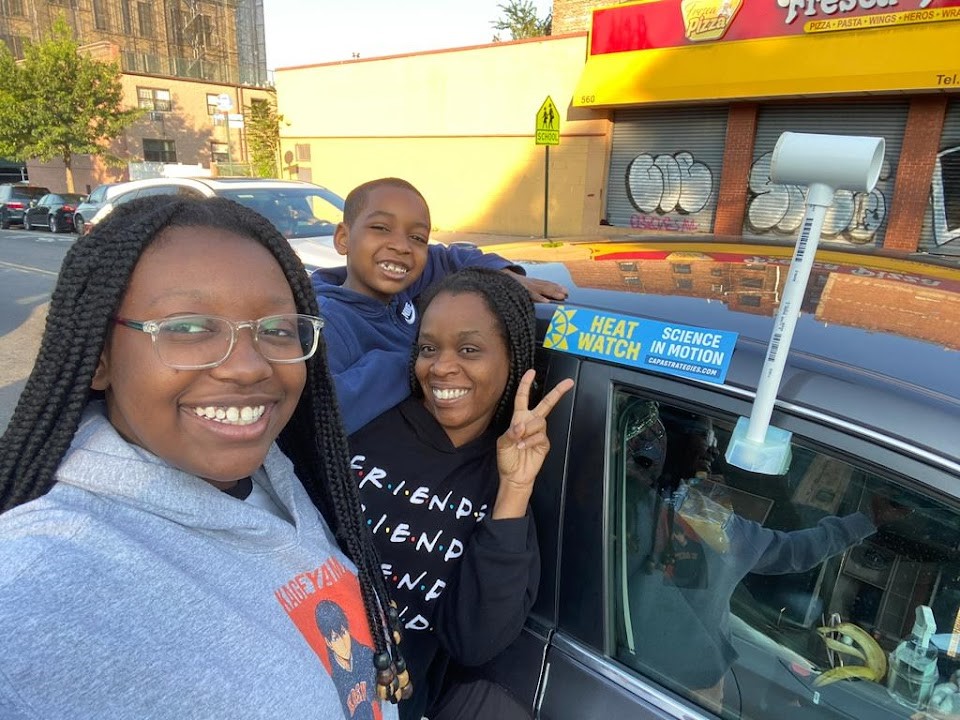
Community-scientists in this project are residents of the areas most-affected by heat who participated in data collection. Overall, 81 community scientists participated in data collection for NY and NJ combined, traversing along 22 different routes, collecting almost 100,000 total data points. The goal was to have diverse participation from local community members who are disproportionately impacted by extreme heat. Participants were compensated for their time, which was for about 1 hour of training before the day and 3.5 hours on average on campaign day.
How were the data collected?
The traverse routes for collecting data were designed together with SBU as well as other local groups (WE ACT for Environmental Justice based in Harlem, and Community Boards 9-12 in Northern Manhattan) in order to include areas of concern that matter to local residents. These points included major intersections, frequented bus stops, common corridors of activity, as well as areas with public housing. These points were then sent to CAPA Strategies, who designed the traverse routes based on them.
On Saturday July 24, 2021, community scientists traversed along the predetermined 1-hr long routes with the heat sensor in cars or bicycles. Data collection took place three times: morning (6am-7am), afternoon (3pm-4pm), and evening (7pm-8pm). Most routes and vehicles were accompanied by a member of the media, with representation from Science Magazine, the Guardian, Scientific American, the New York Times, Inside Climate, and more. There were 10 different routes in total (9 driving routes and 1 bicycling route).
How do the sensors work?
CAPA Strategies provided sensors called 'Type T Thermocouples'. These sensors fired off every second and captured block-by-block differences in heat and humidity while using a GPS to track geospatial data as well.
How do our methods and results differ from existing data?
- Measures ambient temperature: Previous models have been based on satellite data, which record the temperature of the ground itself, while our campaign measured air temperatures and humidity close to the ground, which is the heat people actually feel.
- Finer spatial resolution: Our map outputs are in higher resolution (1 meter - 10 meters), meaning a finer spatial resolution than most public satellite products related to land surface temperature and air temperature (which are at scales ranging from 30 meters to 1 kilometer). These more granular maps are more conducive to designing targeted local mitigation efforts.
- Real-time, mobile data collection: Data are collected in real time across several different locations, while most existing air temperature data is collected in one stationary location.
- Capture variance throughout the day: Data are collected multiple times in the day (morning, afternoon, and evening) to capture how heat may vary throughout the day.
What can be done to fix this issue?
Ultimately, to rectify urban heat inequality, we need to undo centuries of urban development that have put many marginalized communities along race and class lines at risk. Some mitigation measures include more trees, vegetation and greenspaces, having lighter color rooftops, and having buildings more spread out. Any strategies need to take into account community input and also need to be employed equitably, implemented first in vulnerable* communities disproportionately at risk.
Where do we see this project going? What's ahead for this project?
In addition to the creation of this story map, Columbia researchers will continue to support South Bronx Unite's steadfast work in green and blue space advocacy as our community partner. For anyone interested in getting involved in their efforts, please email Ashley Fontanilla at ashley@southbronxunite.org.
Because shade trees help so much with heat mitigation, efforts will be made to prioritize the planting and maintenance of street trees in areas found to be urban heat islands from the 2021 HeatWatch campaign. Newly planted street trees need more attention than normal in their first few years after being planted. The newly planted trees must be watered when it has not rained enough to keep them healthy. If you live in the NYC area and would like to receive emails about when and how to water newly planted street trees in your neighborhood, sign up at WaterDuty.org
CAPA Strategies hosts all resulting data maps on the Open Science Framework to provide broad and reliable access to all. Data is available in both traverse point and raster form, and there is also a full synthesis report available as well. Additionally, data will be configured into the next Assessment for the NYC Panel on Climate Change (NPCC).
Lastly, we aim to coordinate with decision makers in NYC and NJ to combat inequities in heat exposure and associated health disparities. This could include locating future cooling centers or green spaces in most-affected areas, introducing programs such as allocation of free A/C for disproportionately affected communities or social resilience measures like neighbors and community members doing wellness checks that could reduce disproportionate hospitalizations and deaths. Ultimately, heat inequity cannot be addressed only through targeting heat alone, so we aim for a holistic approach that goes beyond temperature and humidity to center the health and wellness of the most affected communities.
This website was built with OpenStoryMap. All source code and data can be found on GitHub.
Dedicated to Sonny Gaddy.
* Communities and scholars have pointed out that terms such as 'vulnerable communities' or 'vulnerable populations' can be problematic when certain groups of people are portrayed as passive victims without agency to take measures to protect themselves from climate hazards. With this critique in mind, this story map's use of the term “vulnerable” refers to populations that have died at higher rates due to extreme heat, as opposed to conveying certain groups' adaptive capacity or ability to take protective measures against heat. For more, please refer to Schnitter et al., 20221; Arora-Jonsson, 20112; Kaijser & Kronsell, 20143.
- 1 Schnitter R, Moores E, Berry P, Verret M, Buse C, Macdonald C, Perri M & Jubas-Malz D (2022) Climate Change and Health Equity. In P Berry & R Schnitter (Eds.), Health of Canadians in a Changing Climate: Advancing our Knowledge for Action. Ottawa, ON: Government of Canada. Accessed 1 June 2022. Available here.
- 2 Arora-Jonsson S (2011) Virtue and vulnerability: Discourses on women, gender and climate change. Global Environmental Change 21(2): 744-751.
- 3 Kaijser A & Kronsell A (2014) Climate change through the lens of intersectionality. Environmental Politics, 23(3): 417-433.